Chapter 8: Trendlines & Channels
Trendlines and channels are very simple, yet very effective trading tools that really any trader should know how to properly use. Look around and you will see that all professional and successful traders use these 2 tools when making trading decisions. Deemed classic technical analysis, they are one of the oldest tools in use and have proven their value over so many years, and continue to do so, even in today’s ever-changing markets.
First things first, there can exist an upward, or bullish trendline, and a downward, or bearish trendline. An upward trendline is called support and a downward one is viewed as resistance.
Let’s talk about trendlines first:
The most basic definition of an upward trendline is a line that connects 2 swing lows on the chart. Conversely, for a downward trendline, it is a line that connects 2 swing highs.
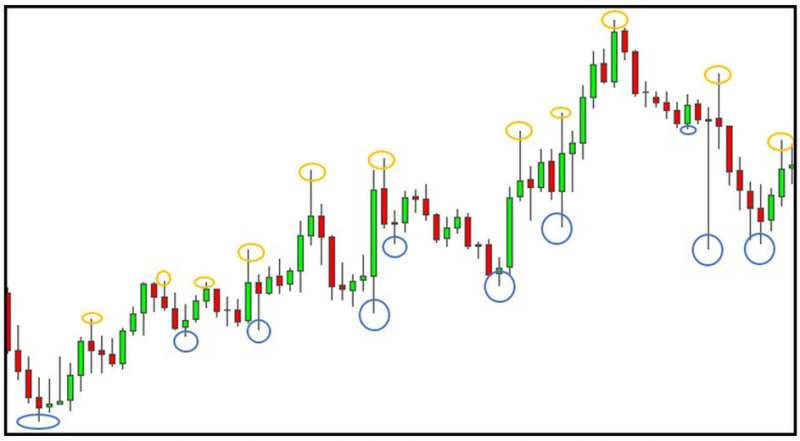
A swing low is a point on the chart, where the immediately preceding low and the immediately following low are higher than this point, marked with blue in the chart below.

A swing high is the reverse thing and is shown in orange in the chart.
Now, take any 2 swing lows or swing highs on the chart and connect them. There will be a simple trendline.
Note that you cannot connect a low and high to form a trendline. The line must connect a low with a low, or a high with a high.
Now, let’s talk about the more practical part. For a trendline to carry more significance, we need at least 3 points connected before we can considering it for a trade. And this is because of a simple rule in technical analysis:
The more times a trendline is touched the more significant it becomes, and the harder it is for the market to break it.
From experience, this is absolutely true.
And once such a strong trendline is broken, usually a nasty and sharp retracement follows.
But, just having a trendline that has been touched at least 3 times, does not mean we can jump into the market right away! Of course, we are going to look for confirmation from other signals like support/resistance levels and candlestick patterns before we take a trade.

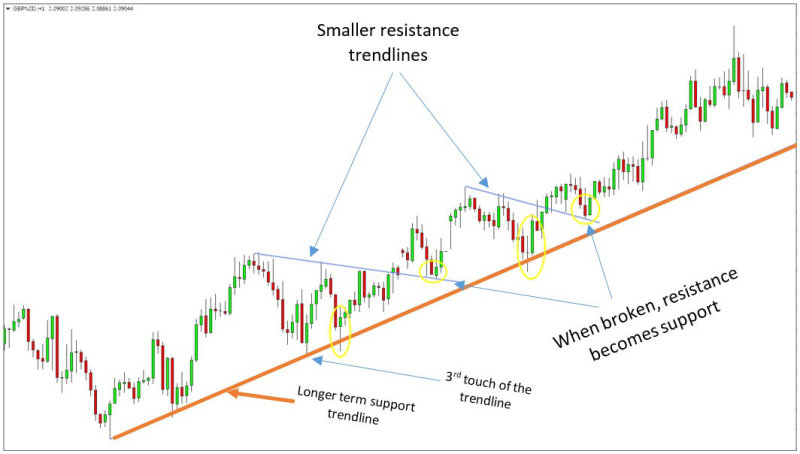
On this GBPNZD chart above, you can see how you can find good entry points using trendlines in combination with prior support/resistance and candlestick patterns. The yellow circles are valid entry points for this trend. The stop would be placed below the low of the candlestick patterns. It’s really amazing how often reversals come with a candlestick pattern.
Now, what are channels?
They are just 2 parallel trendlines acting as both support and resistance.
Like in trendlines, there are upward (bullish) and downward (bearish) channels. The upper trendline is always acting as resistance and the lower trendline is always acting as support.
Channels, by definition, provide more information about the state of the market than trendlines alone do because when there is a channel, you automatically have a profit target as well as entry levels.
The other advantage that channels provide is that you do not have to wait for the second line to be touched 2 or 3 times. Once one of the trendlines has been established you can just draw a parallel line and that will be the valid trendline.

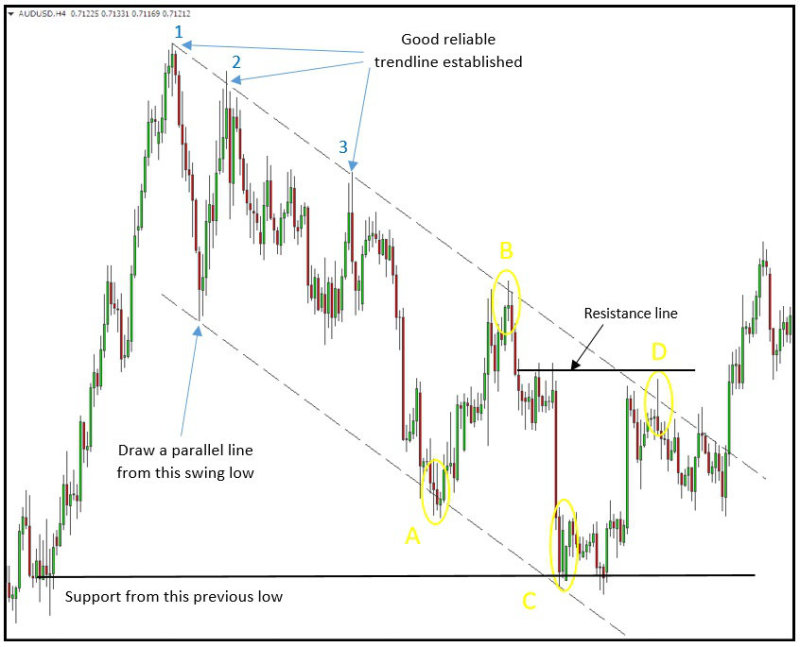
On the AUDUSD chart above, a downward channel is shown. Valid entry points are marked with yellow. On the left side of the chart, normally, there are no entry points because the channel setup was not established yet. After point 3, of the upper trendline, formed, we can draw the lower trendline from the swing low on the left.
Let’s look at the entry points:
Entry point A – A morning star candlestick pattern signals the reversal
Entry point B – An evening star candlestick pattern signals the end of the rally
Entry point C – A previous support zone is present, accompanied by a bullish piercing candlestick pattern
Entry point D – A previous resistance area is present. The reversal comes after a nice bearish engulfing candlestick pattern with a very long wick.
So, one of the goals of this article is to show you how much more successful your trading can be when a combination of signals, which are all pointing in the same direction, is present on the chart.
And lastly, go to your charts and look for trendlines and channels yourself. Test strategies, and combine signals to achieve higher probability trades. Always strive to improve your skills.
