
Chapter 6: Chart Patterns
Just like any other venture, various tools are available in order to successfully trade in any foreign exchange market. However, chart patterns are considered as one of the most important and fundamental tool for every potential investor in this market. Chart patterns can be compared with land mine detectors just to make things funny as both are crucial in spotting explosions before they actually happen. Movements are spotted before they actually happen with the help of various chart patterns. It saves investors from likely explosions and helps them in maximizing their profit.
Real life Forex market condition can depend on various different factors and predicting future with 100% accuracy is usually not possible. At the same time, however, chart patterns are widely considered to be relatively accurate indicators. One of the important things these patterns do is to help understand whether the current price trends will carry on in the same direction or whether the trends would reverse.
The importance of chart patterns cannot be neglected but care must be taken when choosing any particular pattern. An appropriate choice of chart pattern can save considerable amount of time and effort and can provide better results. Double Top, Double Bottom and Head and Shoulders are often the most common chart patterns and are discussed below.
Double Top
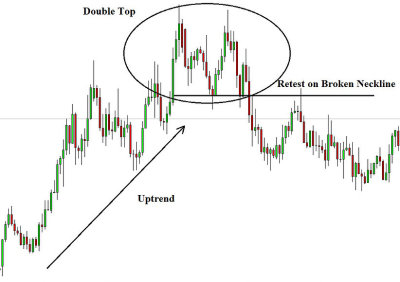
It is an important part of an investor’s overall technical analysis of the market. At the most basic level, it helps in identifying a trend’s rise and the drop which follows and another rise and another drop at the same level. A double top pattern can be indicated at the upward trend peaks. It can be used as an important indicator as it implies a weakening upward trend. Moreover, it shows that buyers have lost interest. The trend is then reversed once the double top pattern is completed.
In its graphical representation, a double top pattern may look like the letter “M”. Resistance level is considered at the two upper point of this “M”. The double top pattern is usually completed in two stages. During an upward trend, a new high is created in the first stage. At its peak, it faces resistance and ultimately reaches a support level. In the next stage, price moves towards the resistance level once again, similar to the previous stage. The same process is repeated as price once again sells off to support level.
Finally, the price of the security breaks down and falls below the support level; hence completing the pattern.
Double Bottom
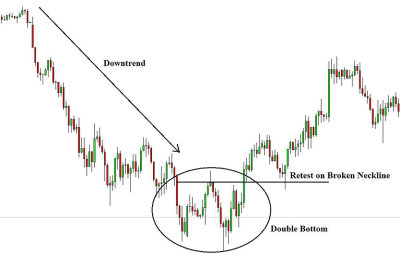
Understanding of the double bottom pattern is closely related to the knowledge of double top pattern (discussed earlier). In fact, both are considered to be opposite to each other. The double bottom chart pattern indicates a downtrend reversal and forms a “W” like shape on chart.
As opposed to the double top pattern, a new low price movement in a downtrend makes the double bottom chart pattern. Support level is ultimately found by the downward move. It no longer moves further downward from this point and instead it will go on to find a new high level. At this new high, the security finds resistance and once again starts a downwards journey going back to its previous low. The two bottom points of “W” indicate the two support levels. The pattern is considered to be completed once the security moves above the resistance level.
Many rules associated with double bottom can also be applicable in the double top chart pattern and vice versa.
Head & Shoulders
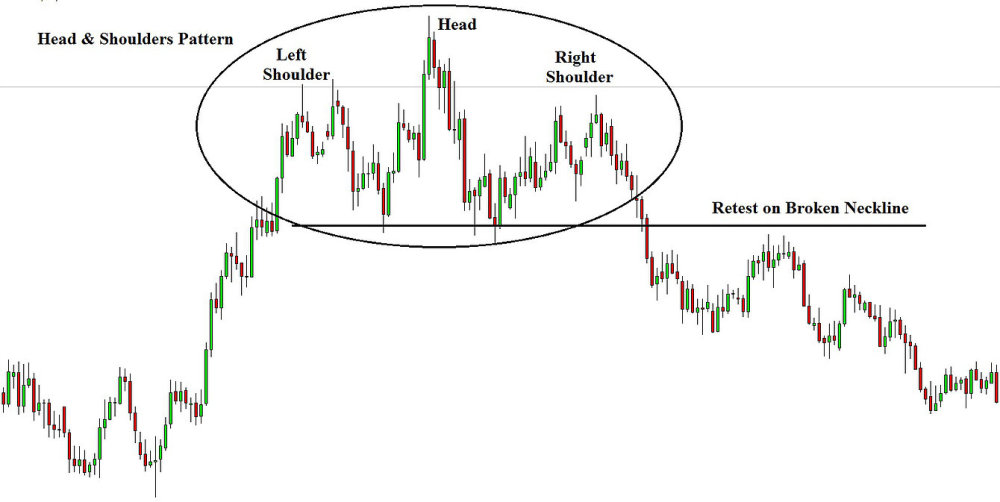
Head & shoulders is another commonly used chart pattern in Forex trading. Working of the head & shoulders chart pattern can be described in three steps. In the first step, price reaches a peak and then declines. In the second step, the price rises again to a new (and higher) peak and ultimately declines. Finally in the third and the last step, the price rises once more (below the previous peak) and then declines to complete the chart pattern. Hence, the second peak is the highest; while first and third peaks remain below this peak. The middle (second) peak is called the head; whereas the other two peaks (first and third) are called shoulders; hence completing the head and shoulders pattern on the chart.
Head and Shoulders pattern is one of those few chart patterns which are very easy to spot on various time frames. A potential trade should be planned beforehand. However, a trader must be patient in order for the pattern to complete. Broken neckline is usually the common entry point for trade.
No pattern can be perfect but the head and shoulders have shown relatively better results. However, it still cannot work at all times and precaution must be taken when making practical decisions. One of the most important tips is to wait for the pattern to fully develop.