
Chapter 5: Candlestick Patterns
If you are reading this article, you surely know about most of the basic concepts related to foreign exchange trading. Basic knowledge can be very helpful in understanding candlestick patterns. These patterns can form an integral part of overall technical analysis and are used to predict future market movements. A candlestick chart is used to graphically depict the current price movements for a particular period of time and to show the future movements as well. The history of use of candlestick patterns can be traced back to late 18th century.
Candlestick patterns are obviously important tool to have in your arsenal for successful trading. However, precaution should be taken as the patterns can be very subjective. This is because of the fact that candlestick patterns fundamentally rely on predefined set of rules. Currently, at least 40 different such patterns are recognized and these patterns can range from very simple patterns to fundamentally complex patterns. Appropriate and careful selection of particular candlestick patterns are shown to have extraordinary favorable results. Big Black Candle, Three Black Crows, Long Legged Doji, Engulfing Bullish Line, Engulfing Bearish Line and Three White Soldiers are some of the famous candlestick patterns. Some of these patterns are further discussed below. However, before we move any further, it should be noted here that all of the candlestick patterns work well in their particular context of surrounding and limitations, including certain time limitations.
Before we go any further, let us incorporate the concept of price action trading, previously discussed in another article. Price action trading is known to increase the overall profitability of trade and is closely related with the concept of candlestick patterns.
Pin Bar
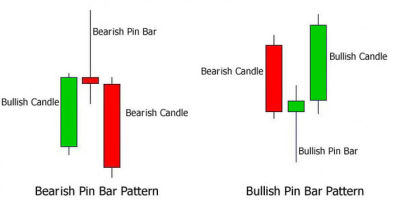
First of all, we are going to discuss the pin bar price action pattern. Pin bar is specifically known to be highly accurate in trending markets. It has an obvious long tail and it may look like Pinocchio’s nose. Pin bars at certain support and resistance levels are often considered to be most accurate. Two simple and easy rules are often recommended in order to maximize one’s profit. Always buy above bullish pin bar (rejected support level) and sell below bearish pin bar (rejected resistance level).
Inside Bar
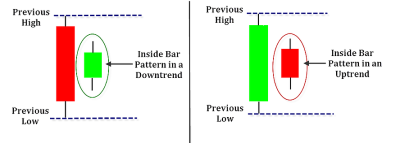
Another important tool is the inside bar. It can be used as a trend continuation signal as well as an important turning point signal. As a beginner, a trader should focus on its use as a continuation signal as other uses can be more sophisticated. Inside bars are most effective in daily as well as weekly charts and are often famous for minimizing risks and maximizing reward. Inside bars should not be used in any time frame less than a single day. In its graphical representation, an inside bar usually stays within the range of its immediate earlier bar. It can also be explained in these words that the second bar is likely to have a higher low and a lower high. Inside bar can be a great tool but it must be used with reasonable care. It is often recommended to place only a single order (sell or buy) according to the prevailing trend.
Fakey Bar
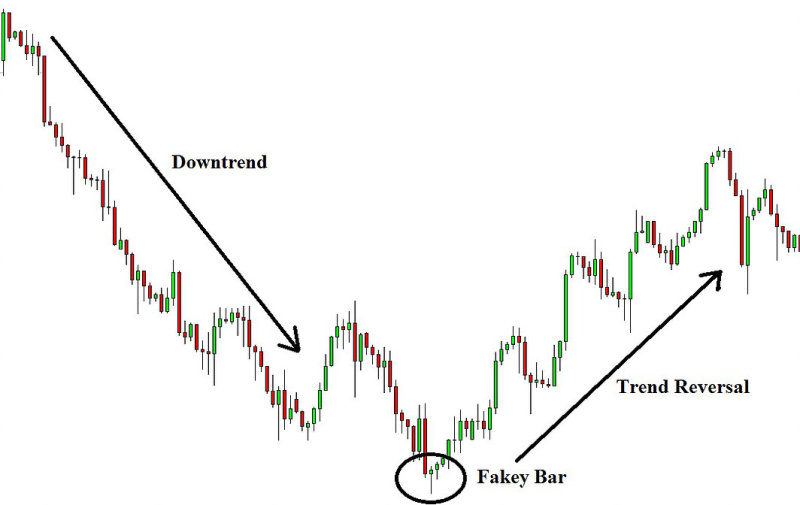
Like pin bar and inside bar, fakey bar can also be an important part of price action strategy. In any market, rejection of any important level can be easily indicated with the help of fakey bar. It is a common observation that market often seems to move in a single direction for a certain period of time and then suddenly reverses back. Such a situation can wipe out all market amateurs, leaving some experienced professionals with large sums of money. The fakey bar setup can be used to set off big and important moves in a foreign exchange market.
Engulfing Bar
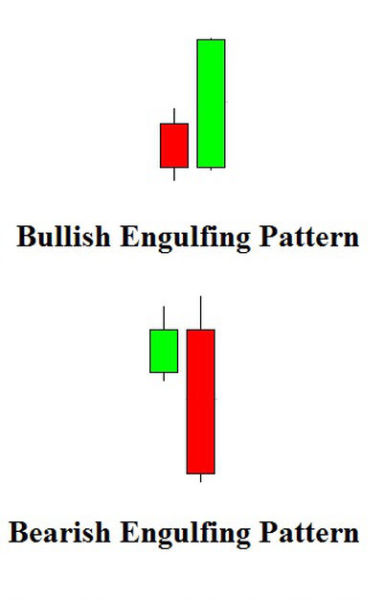
Another important term related to this topic includes bullish engulfing and bearish engulfing. A bullish engulfing pattern is formed when a large bullish candlestick follows a small bearish candlestick. The small candlestick has small shadow (or tail), allowing the larger candlestick to cover the previous day’s entire candlestick. On the other hand, bearish engulfing pattern is the opposite. A large bearish candlestick follows a shorter bullish candlestick.
Bullish engulfing pattern usually means a declining security trend. It is recommended to take account of preceding and the following day’s price into consideration in order to make decisions. On the other hand, Bearish engulfing pattern suggests that bears are in control of the security. What it means is that an uptrend and peak is expected. However, similar recommendation of considering preceding and following day’s price is still applicable.
Both these engulfing patterns are seen with skepticism but these patterns have survived over the centuries and have helped millions of investors in making better decisions and trades. These candlestick patterns are specifically popular in Japan and many Japanese traders consider them as the most convincing tool when it comes to statistical analysis.