
Chapter 11: Divergence
Divergence is an important leading sign of a trend reversal. Highly accurate reversal signals can be generated in combination with other trading tools.
In technical analysis, the most common divergence used is that of price and one of the momentum oscillators (usually used are Stochastic, MACD or RSI).
When the price is making higher highs, in order for the move to be viewed as a genuine uptrend, it needs to be backed up by increasing bullish momentum, which is indicated by an oscillator that is also making higher highs. In a downtrend, it is just the opposite. Price makes lower lows and the momentum oscillator should do the same.
The price and momentum oscillators will usually mimic each other and normally are moving in the same direction. Thus, we generally have a convergence of price and momentum oscillators.
Regular Divergence
A divergence, on the other hand, occurs when price makes a higher swing, but the momentum oscillator fails to do the same and instead stays flat or even turns down. This indicates that the last swing high of the uptrend didn’t have the same strong momentum as before and this, in turn, is seen as a sign of weakness in the ongoing trend. This is called normal, or regular divergence.
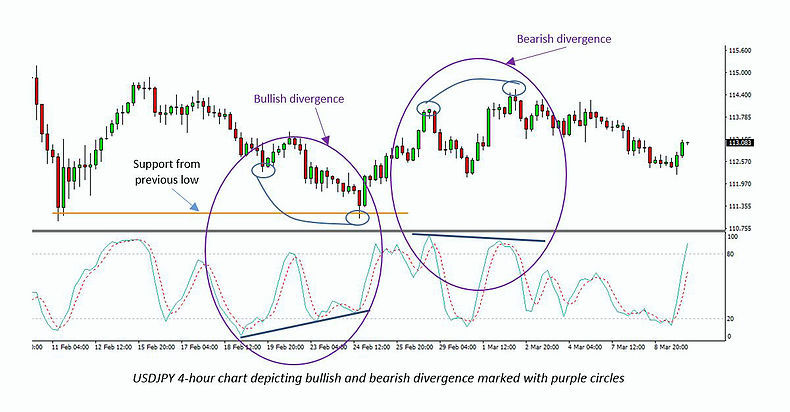
In the first purple circle, you can see how price made a lower low, but the Stochastic oscillator failed to make a lower low, and instead made a higher low (shown with the upward blue line). This is a classic bullish divergence and in this case, it was accompanied by support from the previous low. When a combination like this occurs, the chances of a price reversal are significantly increased.
In the second purple circle, the opposite, a bearish divergence is shown. Here, price managed to make a higher swing high, but the oscillator’s reading made a lower high. As you can see price reversed from here as well.
Hidden Divergence
Another, trickier, less known type of divergence is hidden divergence. This is, in a way, the opposite of regular divergence. It occurs when the oscillator makes a higher high and price makes a lower high. However, the difference is, in that, unlike regular divergence, hidden divergence is a signal for trend continuation instead of a trend reversal.
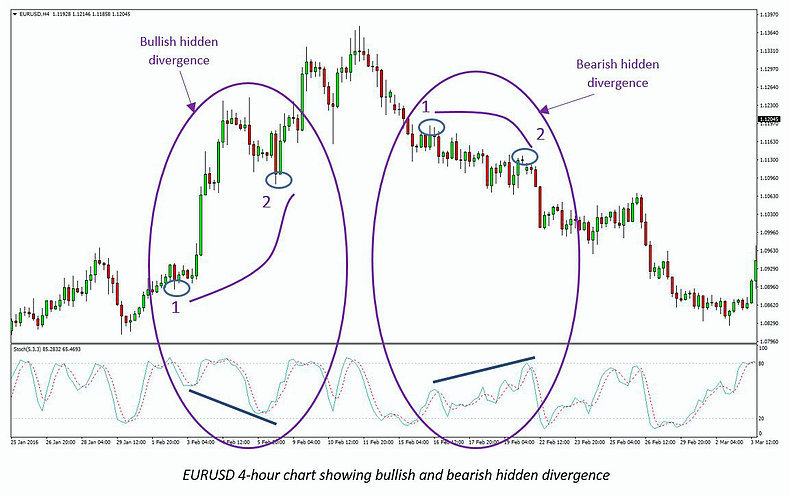
On this EUR/USD chart above, you can see how hidden bullish divergence can be a sign of trend continuation. In the first case on the left, the price was in an uptrend and then started to retrace down, finishing at point 2. This retracement was small, however, the Stochastic oscillator made a lower low on this swing low than the low at point 1. This is marked with the declining navy-blue line. The divergence between the oscillator and price was a sign that the uptrend will make another swing higher.
In the second case on the right, hidden bearish divergence signalled the continuation of the new downtrend. Price slowly declined, making lower highs, but the oscillator raised higher than the first high, at point 1. This was a good opportunity to sell the pair.
How To Trade Divergence
As we said, in the beginning, you can use any momentum oscillator to spot divergences. It is best to use one that you are comfortable with and works best for you. If do not have a favorite oscillator yet, try the 3 most popular oscillators (MACD, Stochastic and RSI).
The most important thing you need to be aware of is, that, like everything in trading, a divergence signal is not correct a 100% of the time. In fact, whenever you spot a divergence on the chart, you must have confirmation from other signals or tools before entering a trade. That is why you need to analyze your charts in context and look at the bigger picture. Check what is happening on the higher timeframes. Is divergence occurring at a support or resistance zone? Is a strong Fibonacci level nearby? Any confirmation signal will increase the probabilities for a profitable trade.
Another way to confirm the trade is to wait for the oscillator lines to crossover (does not apply for RSI). If you spot a bullish divergence with the MACD for example, you do not have to enter immediately but instead, wait for the MACD lines to crossover to the upside, and then enter. The downside of this method is that you will enter a little later and part of the profits will be left on the table.
So, go on and practice your newly learned skills to strengthen and solidify them. As with all skills, here too, practice makes perfect.