
Chapter 9: Fibonacci
The Fibonacci levels are a very popular and successful technical trading tool, that is extensively applied in trading the currency market. Because of the very high liquidity of the Forex market, these Fibonacci levels work extremely well on all major currency pairs. Whole trading methods have been created based solely on these levels. There is one specific branch of Fibonacci analysis, called Harmonic Trading, which uses a combination of these ratios to form unique price patterns that give very high probability reversal signals.
The Fibonacci levels provide several important advantages like:
1.Revealing, in advance, where turning points may exist.
2.No need for previous support or resistance to exist, Fibonacci retracements and extensions can be calculated 3.anywhere and anytime on the chart. All you need is to find a swing in the market, pull out the Fibonacci tool on 4.your trading platform and it will draw your levels.
5.Multiple Fibonacci levels can be used to look for a confluence area.
So, what are these fascinating Fibonacci levels?

These are mathematical relationships or ratios, that exist literally everywhere around us. Most natural progressions and growth, occur in harmony with these Fibonacci relationships. They were named after the man who discovered them, genius 13th-century Italian Mathematician Leonardo Bonacci (nicknamed Fibonacci).
Fibonacci ratios that are used in trading are:
Retracements: 0.146, 0.236, 0.382, 0.50, 0.618, 0.702, 0.764, 0.786, 0.886.
Extensions: 1.128, 1.272, 1.382, 1.414, 1.618, 2.0, 2.24, 2.618, 3.14 (Pi), 3.618, 4.618
Note that, it is highly inconvenient to use all of them on the chart because that will completely confuse you. It is advisable for you to open up your charts and see which of these levels work best for you. Place them all on past price data and test them. Adapt them to your other trading strategies and choose the ones that help you to see the market clearer.
It is always a good idea to practise and backtest any strategy which you would want to execute on your live trading account.
However, keep in mind that out of all these levels that are listed, most significant ones for trading are:
0.382 or (38.2%) – A modest retracement, mainly found in trending markets. Usually, price will respect this level, even if it is just a quick pause in the move.
0.50 (50%) – Half way of a swing. Important psychological level.
0.618 (61.8%) – Somewhat deep retracement. This is the golden ratio – retracement level. Price will definitely respect it in some way, and even completely reverse from it.
And
1.618 (161.8%) – The golden ratio – extension level. It i most often used for determining where a market swing will end, usually looking for a good place to take profit.
2.618 (261.8%) – An extreme extension level. It is not used very often because the market rarely moves in such large swings.
So what are the most important and best ways to use Fibonacci ratios in your technical analysis?
If there is any general truth in technical analysis, it will be a confluence of signals which provides the best trading results. The more technical signals exist at the same level the better the chances are for you to make a profit.
Find out where classical support and resistance exist and see if any Fibonacci levels happen to be in the same area. If so, this is a much better trade than if only one of them was in place.
And this is true for fundamentals too. Always look for confirmation from as many indicators and sources as possible before deciding on taking a trade.
In this regard, you can also look for multiple Fibonacci levels converging in the same area. A single Fibonacci level can be significant, but when 2 or 3 converge in the same area that is surely more significant.
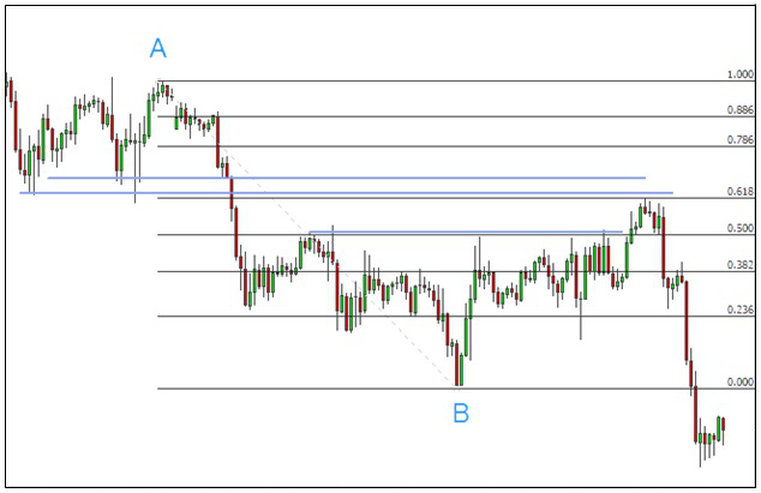
On the chart above, we have the AB downswing. We apply the Fibonacci tool with the retracement levels. See how the market respected, first, the 38.2% level by not closing above it. Then after taking it out, the market had trouble with the 50% level, before finally just touching the 61.8% level, and completely crushing down. Additionally, there is classic resistance, shown with the blue lines. This is just to show you how powerful are the Fibonacci levels, especially when combined with other tools, like support and resistance.
Lastly, understand that the Fibonacci levels alone are not a directional indicator, meaning they do not reveal which direction you should enter the market. You need to use other indicators for that purpose, or even better fundamental analysis. But, what it does show, is good levels which the market will have difficulty breaking, and where the chances of a trend reversal are higher.